6. Mission Revision and Analysis
The Neptus interface for analyzing the collected data is the MRA (Mission Review and Analysis) shown in figure. This interface is targeted at viewing IMC logs and other collected sensor data (for sensors that have own specific file formats).
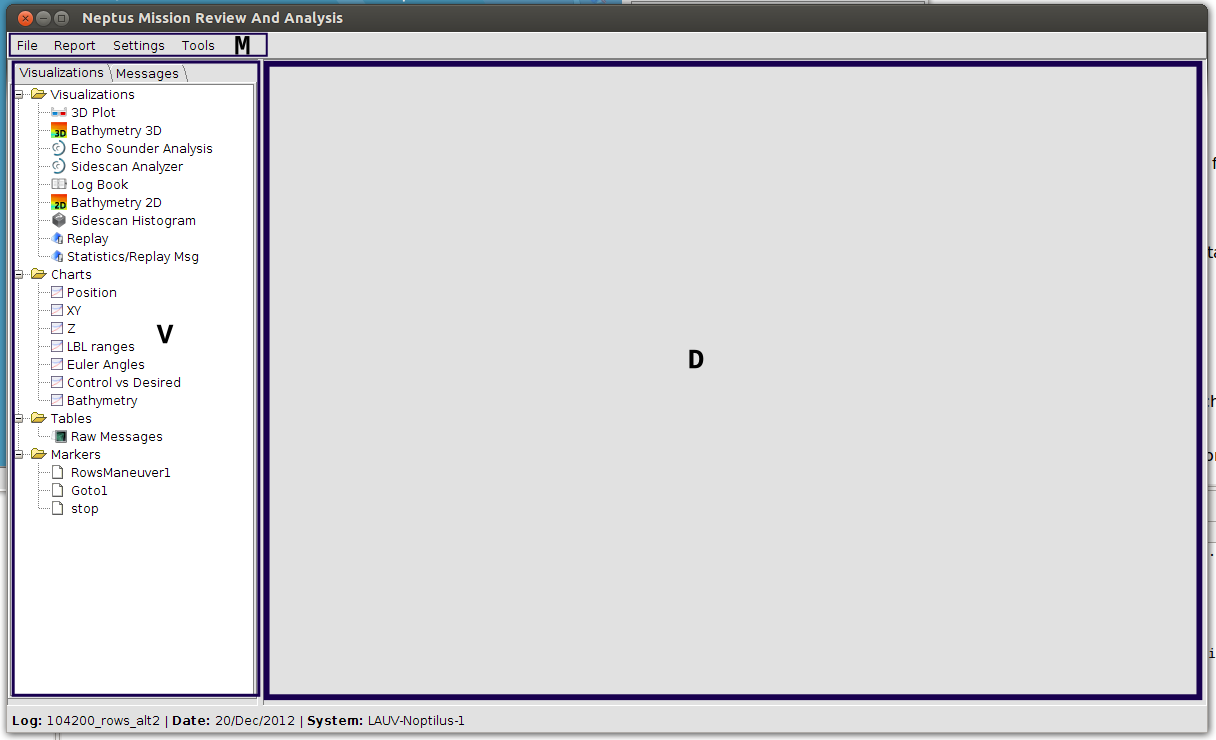
The layout sections: M for menu bar, V for visualizations selection, D for display panel.
Logs are produced onboard devices by serializing generated messages and concatenating them into one or more binary files. In order to present the data, these files are initially indexed and merged with files logged onboard other systems, ordering them by the origin timestamp.
As a result, both operator commands and multi-vehicle surveys can be concentrated in a single log file and visualized.
MRA interface is divided in two parts. On the left side, the messages and available visualizations are listed, while on the right the active visualization is displayed. Any IMC message can be inspected rapidly in a tabular form or as a multi-variable/multi-message time-series plot. Some plots are predefined and others can be created inside MRA by selecting fields to plot. Moreover, plots can also be created in Javascript derived language and saved as a plot script.
Other specialized visualizations are also available, and similarly to the console widgets, can be added as Neptus plug-ins. Examples of these specialized visualizations are the sidescan analyzer, multi-variable plots, mission replays with map overlays, a photo visualization plugin, 3D bathymetry and trajectory visualizations, and more. You can check MRA Components section for more details.
6.2. Visualizations/Messages Tabs
This component is where you can select and create the visualizations. It is composed by two tabs: the Visualizations Tree and Messages Tab.
6.2.1. Visualizations Tree
The visualizations tree is the MRA component where you can find the available/opened visualizations and also some informations of the log.
In the tree you find four branches:
- Visualizations — Here you find a list of available visualizations for the opened log.
- Charts — Here you find a list of available and created plots for the opened log.
- Tables — Here you find a list of available and created tabular data for the opened log.
- Markers — Here you find a list of markers created for the opened log.
Check MRA Components section for more information on the visualizations.
6.2.2. Messages Tab
The message tab lists all IMC messages. It takes the form of a tree where the branches are the messages types ans the leaves are the message fields.
By selecting the message type and Mouse Right Click it, you can see all the messages of that type in a tabular manner.
You can also create plots using the messages fields. To do this you can select one or more messages fields (use Ctrl click to select more than one field, also selecting across messages) and Mouse Right Click. A pop up menu will unveil with plot options. Check MRA Components section for more information on plots.
6.3. Display Panel
The display panel will be where you will find the active visualization that you created or selected in the visualization tree.
