In this section we will give you a in-depth view of the building blocks.
8.3. Maneuvers
In the following sections we will explain the details of some maneuvers most commonlly used.
The available maneuvers for a specific vehicle can be seen when editing a plan to that vehicle.
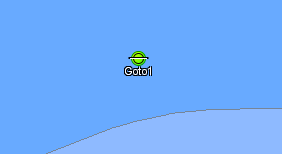
8.3.1. Goto
The Goto maneuver is used to make a vehicle travel to a waypoint. The figure
shows the graphical representation of this maneuver.
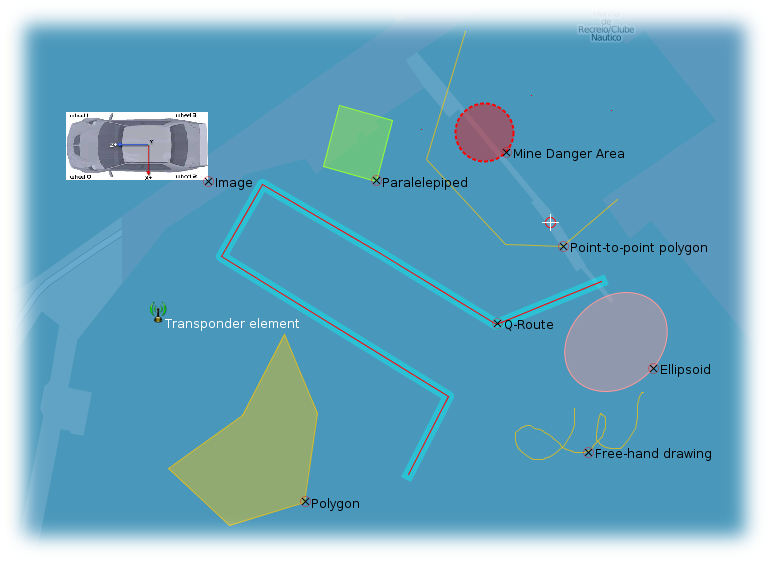
8.3.1.1. Maneuvers Common Graphical Representation
The green indicates that the maneuver is the initial maneuver of the plan. If blue indicates a
geo-referenced maneuver and grey if not. Please note that in most maneuvers this point represents
the initial or end points for the maneuver, but may also be a place holder/reference for the maneuver.
In a plan the entry and exit arcs to/from the maneuver are the actuals passage points.
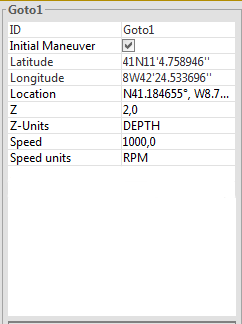
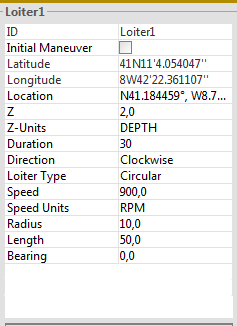
8.3.1.2. Maneuvers Common Parameters
The Goto maneuver serves algo to describe some common parameters to all maneuvers (as depicted in
the figure).
Parameters:
Initial Maneuver indicates/sets this maneuver as the plan start maneuver.
Latitude, Longitude, Location indicates the location for the maneuver
(these are only editable on the map).
Z the Z to use in the maneuver (its meaning depends on the Z_Units).
- Z-Units the Z units can be NONE, DEPTH, ALTITUDE, or HEIGHT:
- NONE means Z has no reference.
- DEPTH means water surface is the zero for Z (positive values means more depth).
- ALTITUDE means ground surface is the zero for Z (positive values means more altitude).
- HEIGHT means WGS-84 height value.
Speed sets the speed to be used in the maneuver (or in some cases an indicative
speed to be used).
Speed units the speed units can be RPM, m/s, or % in the execution of the maneuver
given the position error.
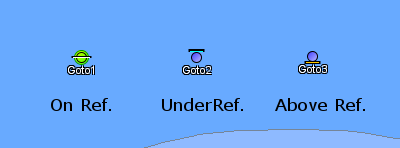
In the figure, one can see a dash at the middle, bottom, and above of
the filled circle. The dash has the following meanings (dependent of the Z-Units):
- At the bottom, as in the figure, means that the waypoint of the maneuver is set bellow the reference.
- At the middle means that the waypoint of the maneuver is set on the reference.
- At the top means that the waypoint of the maneuver is set above the reference.
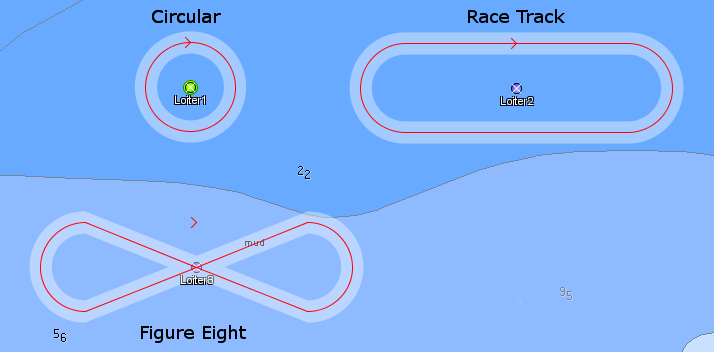
8.3.2. Loiter
This maneuver is used to loiter the vehicle. This can be done in a circular, a race track, or a
figure eight patterns. These modes can be seen in the following figure.
Warning
 For the LAUV the only available loiter pattern is CIRCULAR.
See Goto maneuver for the common graphical representation.
The common parameters can be seen in the Goto maneuver. The rest are described next
(depicted in the figure):
- Duration sets the duration for the loitering (in seconds, 0 for unlimited).
- Direction sets if the path will be clockwise or counter-clockwise.
- Loiter Type sets the type of movement for the loiter: circular, race track, or figure eight.
- Length sets the length for the loiter pattern.
- Bearing sets the bearing (in circular this does not apply).
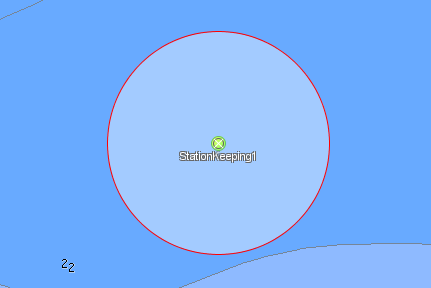
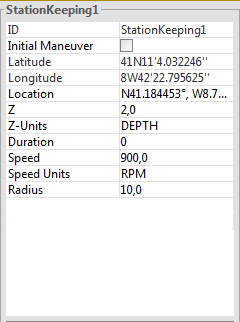
8.3.3. Station Keeping
Station keeping is similar to loitering but does not force a pattern.
This will only keep the vehicle in an area.
In this maneuver it only depends on GPS and not vehicle’s navigation.
Warning
For the LAUV this will be done only at surface. So it will ignore Z and speed.
See Goto maneuver for the common graphical representation.
The common parameters can be seen in the Goto maneuver. The rest are described next
(depicted in the figure):
- Duration sets the duration for the loitering (in seconds, 0 for unlimited).
- Radius sets the radius for the hover box.
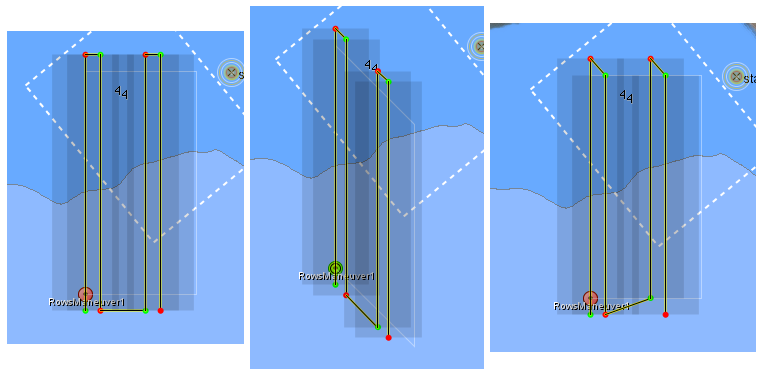
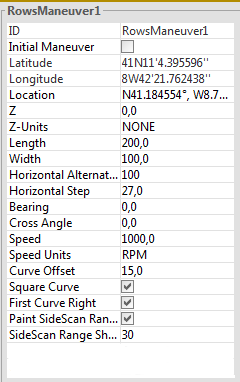
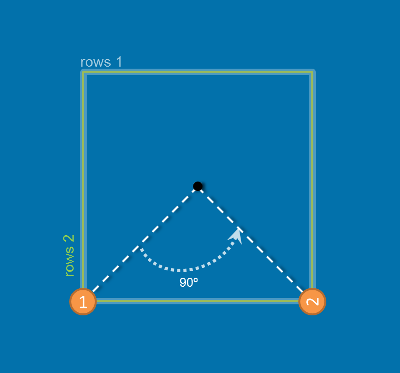
8.3.4. Rows
Rows maneuver (also known as lawn mower pattern) is use to survey areas. The figure
depicts some configurations of this maneuver.
(See Goto maneuver for the common graphical representation.)
The common parameters can be seen in the Goto maneuver. The rest are described next
(depicted in the figure):
Length is visual described in the following picture. This sets the length of the rows box.
Width is visual described in the following picture. This sets the width of the rows box.
Horizontal Step is visual described in the following picture. This sets the distance between
consecutive row legs.
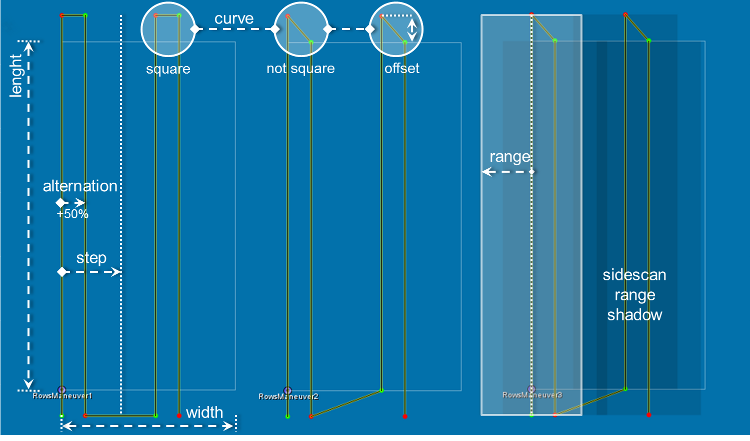
Horizontal Alternation is visual described in the following picture. If this value is 100%,
then there will be an even spacing between the row legs. A different value will allow non-even
spacing benefiting side scan sonar imagery. In the left rows maneuver of the following figure,
the meaning of this parameter is shown. If the alternation is +50%, it means that the spacing in
each legs pair between non-even to even leg will be 50% of the value of the horizontal step. The
spacing between non-even legs will always be the double of the horizontal step.
Curve Offset is visual described in the following picture. This value denotes the extra
distance in meters that the vehicle will travel before turning to the next leg.
Square Curve is visual described in the following picture. This will set if the curve will be
in a square form or after the curve offset the vehicle will follow straight to the box edge. (The
first option will allow a more smooth entry on the rows box.)
Paint SideScan Range Shadow is visual described in the following picture in the right rows
maneuver. If checked it will paint the shadow according to the range set in the following parameter.
SideScan Range Shadow is visual described in the following picture.This will set the range of
the SideScan. This is a visual aid and does not configure the side scan itself.
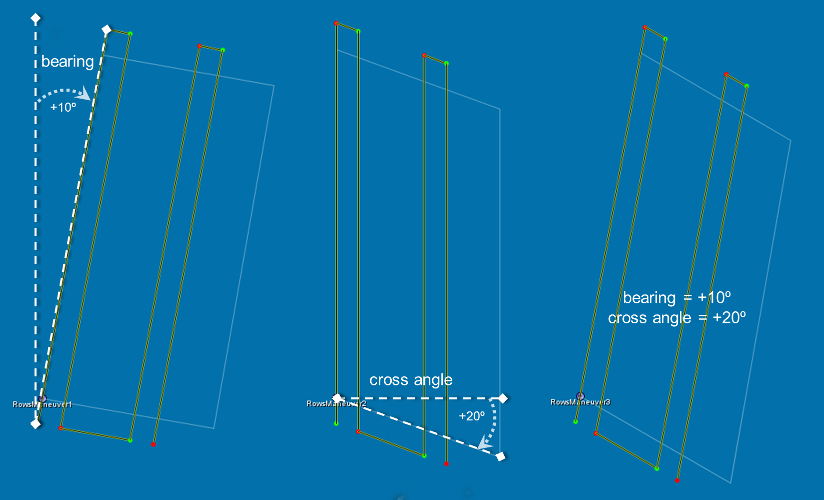
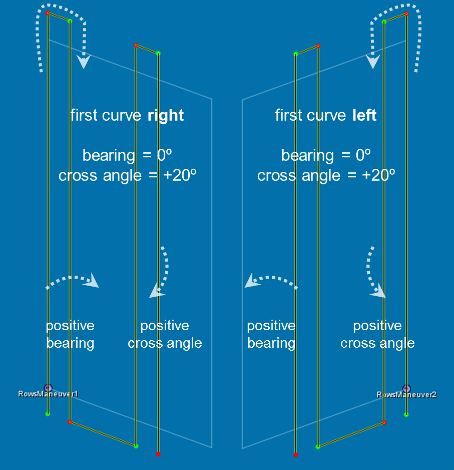
Bearing is visual described in the following picture. This value sets the initial
bearing the pattern.
Cross Angle is visual described in the following picture. This value defines the cross
angle for the pattern as shown in figure. This value affects the pattern geometry before the
bearing is applied. This can be seen in the right part of the following figure.
First Curve Right is visual described in the following picture. This setting
allows this pattern to be executed mirrored. Be aware of the positive rotation for
the bearing angle and cross angle.
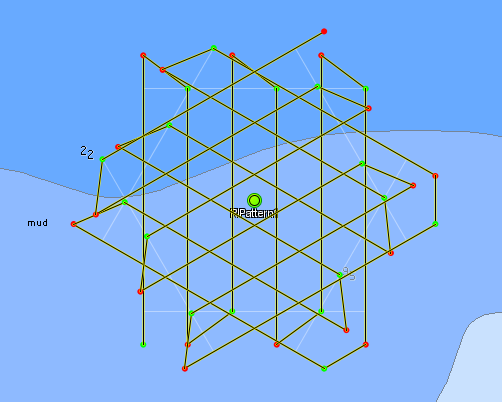
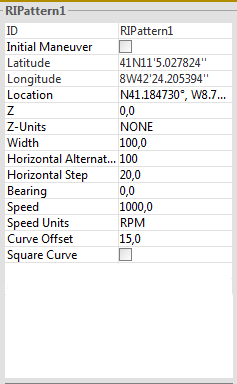
8.3.5. RI Pattern
This Reacquire-Identify pattern maneuver can be use to search for something.
The figure depicts some configurations of this maneuver.
(See Goto maneuver for the common graphical representation.)
This pattern is a composition of three rows pattern maneuver (with the length equal to the width).
As it can be seen in the following figure, the composition is done by rotating by the middle by 60°
between each row pattern. In this maneuver the middle point is the handle and differs from the start
and stop waypoints.
The common parameters can be seen in the Goto maneuver.
The rest are described described in the Rows Maneuver.
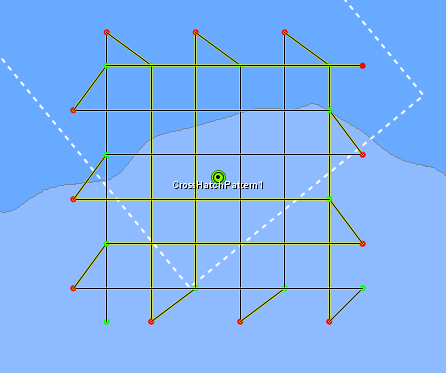
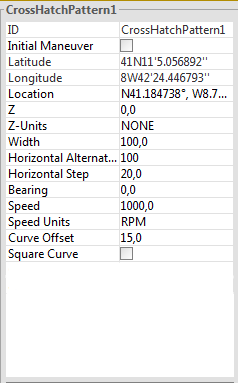
8.3.6. Cross Hatch Pattern
This Cross Hatch pattern maneuver can be use to search for something.
The figure depicts this maneuver.
(See Goto maneuver for the common graphical representation.)
This pattern is a composition of two rows pattern maneuver (with the length equal to the width).
As it can be seen in the following figure, the composition is done by rotating by the middle by
90° between the two row pattern. In this maneuver the middle point is the handle and differs from
the start and stop waypoints.
The common parameters can be seen in the Goto maneuver.
The rest are described described in the Rows Maneuver.
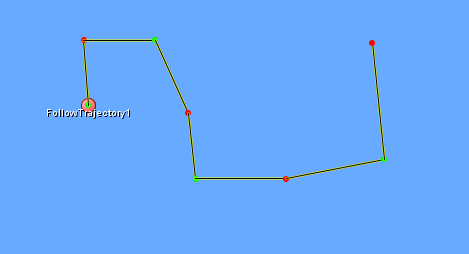
8.3.7. Follow Path and Follow Trajectory
These two maneuvers are similar. The difference is that FollowTrajectory has an attached time to
be at a specific path point. The following figure depicts an example of these maneuvers.
(See Goto maneuver for the common graphical representation.)
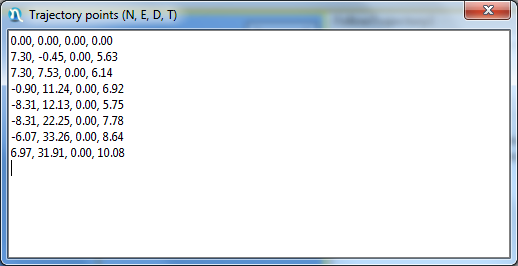
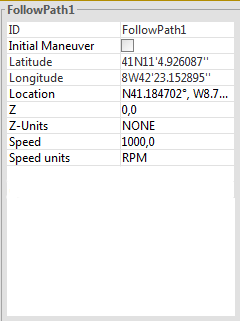
The path can be drawn visually or edited in a text form (mouse click access) as shown in the
following figure. Each line represents a path point represent by north offset, east offset,
down offset, and time offset (seconds). The offsets are in meters from the maneuver handle location.
The common parameters can be seen in the Goto maneuver.
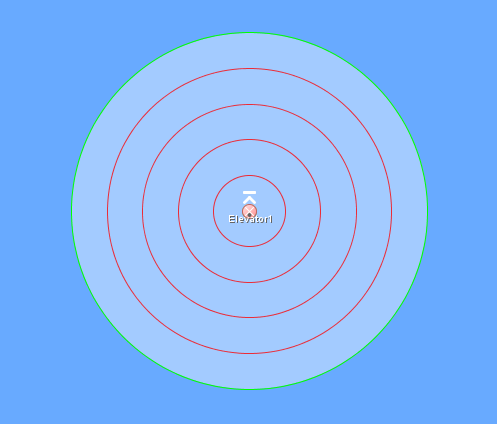
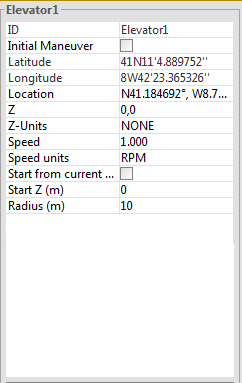
8.3.8. Elevator
The Elevator maneuver is intended to make the vehicle change depth/altitude in an small area.
The figure depicts this maneuver.
(See Goto maneuver for the common graphical representation.)
The common parameters can be seen in the Goto maneuver. The rest are described next
(depicted in the figure):
- Z sets the final Z that the vehicle will hold at the end of the maneuver. Visually
if the vehicle will ascend there will be an horizontal dash and a arrow pointing up bellow
it (in the figure depicting this maneuver). If it will descend the arrow will be pointing
down and above the horizontal dash. If it will do neither, only the horizontal dash will be
drawn, with the exception if Start from current position is set. In this case, ascending or
descending depends on the previous state of the vehicle.
- Radius for use in ascent/descent. If 0 the controller to should use a custom control strategy.
- Start from current position makes this maneuver start from current position or travel
first to the location in the location parameter. If this is set the circle will be filled red.
- Start Z sets the initial Z (if the flag Start from current position is not set).
Warning
When the vehicle gets to the End Z (at the desired Latitude/Longitude) the maneuver is completed.
For keeping its position you should use another maneuver.
8.4. Console Components
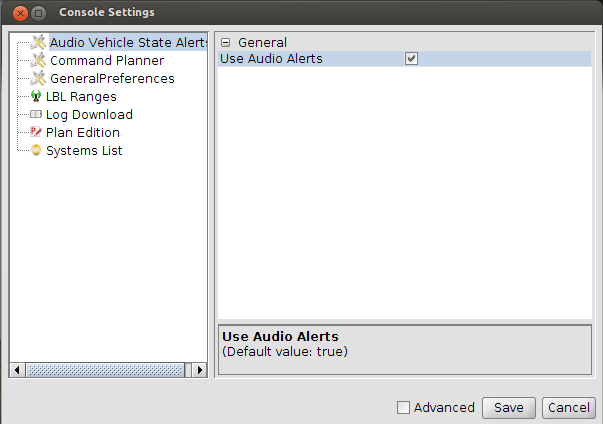
8.4.1. Settings
The settings window is composed of a Functionality list on the left, a space for properties panel on
the right and three buttons on the bottom.
Functionality List On the left there is a list of all the configurable functionalities.
Select one to see the associated properties on the Properties Panel.
Properties Panel On the right there is a panel where the settings of the selected functionality
are displayed. All properties with an asterisk (*) affect all windows of Neptus (both console and
mission review) while the others only affect the console.
Buttons On the bottom, are the “Advanced” check box, the “Save” button and the “Cancel” button.
- Advanced check box: When selected, makes all the advanced properties visible.
Be advised that properties that are normally hidden should not be edited, this is only for
users that know how this properties affect Neptus.
- Save button: The Save button saves all the changes and closes the window.
- Cancel button: The cancel button closes the window without saving.
Example of Use
In the console, select Settings from the top bar. Then select All Settings.
In the Functionality List, select “Audio Vehicle State Alerts”, then uncheck the check box.
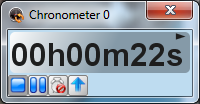
8.4.3. Chronometer
This component provides an chronometer functionality. On an operational console one
can be opened by typing Ctrl-K keys.
The first button is to start/stop the time count. The second is to pause/resume the time
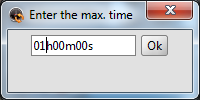
count. The third configures the a time so countdown function can be used (configuration
opens the dialog depicted in the following figure). The last button configure the count
to be up or down direction (counting down will only work if a time to count from is
configured, once the time reaches the configured time the backgroung turns red).
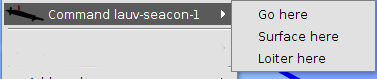
8.4.4. Command Planner
The command planner allows to send vehicles to some location, just by traveling or
by loitering there. This component shows itself as menus on the renderer and can be
seen in the following figure.
As seen in the figure, this functionality is identified
by the word Command and the vehicles that can be commanded at that time.
There are some configurations you can make to the execution of these commands dependent
on the type of vehicle (underwater, surface, or areal). This includes the depth or altitude
the command will be executed, the radius of loiters and speeds.
- The commands that can be issue are:
- Go here – sends a Goto maneuver with the map clicked location;
- Surface here – sends a Station Keeping maneuver with the map clicked location (this
for AUVs and ASVs will be done at surface);
- Loiter here – sends a Loiter maneuver with the map clicked location.
Warning
Upon click on the selected command, it will be issue immediately to the vehicle.
8.4.6. Entity State Panel
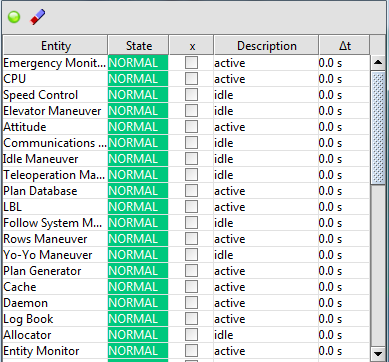
This operational console component allows the visualization of the entities state
reported by the system. The next figure depicts this panel.
This panel shows the entities in a tabular form. The first column shows the entity
name. The second indicates the state (see bellow for the meaning). The third allows
the user to ignore the state for the summary alarm. The forth shows the description
as sent by the system. The last column indicates the age of the information for that
entity.
The previous figure, has an led indicator that summarizes the state of all entities.
The eraser button, erases all the states and resets the table.
The next table indicates the states, color codes, and meanings.
Entity Color Codes
| Color |
Meaning |
Description |
|---|
| Grey |
– |
Does not have any particular meaning. |
| Green |
Normal |
Indicates that all is normal. |
| Blue |
Info |
Indicates that some action is being done like boot or
initialization, but does not mean error state. |
| Yellow |
Fault |
Indicates a minor error. This fault may evolved to an error. |
| Orange |
Error |
This indicates an error in an entity and if persists it may
evolve into an failure. |
| Red |
Failure |
This indicates a failure in an entity, This may cause the entity
to break. |
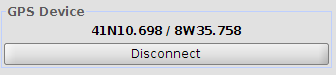
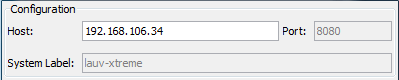
8.4.7. GPS Panel
This operational console component allows the connection of an external GPS device to
Neptus. This will feed MyLocation and other plugins with an updated base position and
heading. Regarding the heading, one should be carefull because if the GPS does not have
a compass, the heading is only valid if you are moving. The figure bellow depicts this
panel when connected.
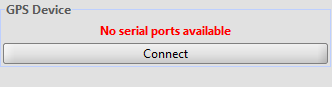
To connect the GPS Panel you need to connect an external GPS device either by serial
port or USB. Then click Connect button. If no ports are available the indication of
No serial port available indication as the figure bellow. This might be indication
of a missing driver for the connection. In this case you should check your GPS manual
or, if you are using a converter it’s manual.
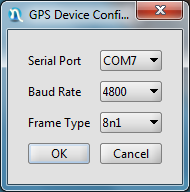
If serial ports are available, the following dialog (depicted in the figure).
You should choose the port ant the rest of the connection settings (the default should
be ok).
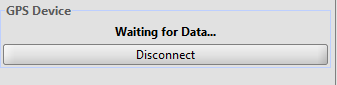
After pressing ok, the panel will scan the configured port for valid GPS data (as
depicted in the following figure).
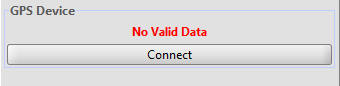
Then it will either show an error No Valid Data (as depicted in the following
figure), or the latitude/longitude data.
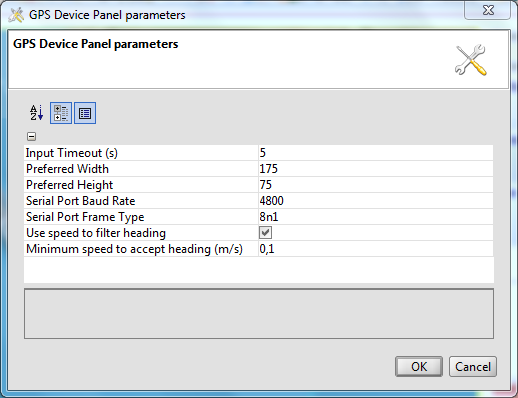
The following figure shows the settings used by this panel.
Their meanings are:
- Input Timeout (s): Configures the timeout in seconds.
- Preferred Width: The width that the panel should present itself by default.
- Preferred Height: The height that the panel should present itself by default.
- Serial Port Device: The default serial port.
- Serial Port Baud Rate: The default baud rate.
- Serial Port Frame Type: The default frame time.
- Use speed to filter heading: In order to use the heading from the GPS without
a compass a filter for speed should be applied.
- Minimum speed to accept heading (m/s): The minimum speed above which the heading
will be used (to filter the erroneous heading when we are almost stopped).
..consoleElements/incommingData.rst-i .. Incomming Data (pode n estar traduzivel)
.. include:: consoleElements/lblRangeDisplay.rst-i
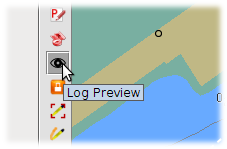
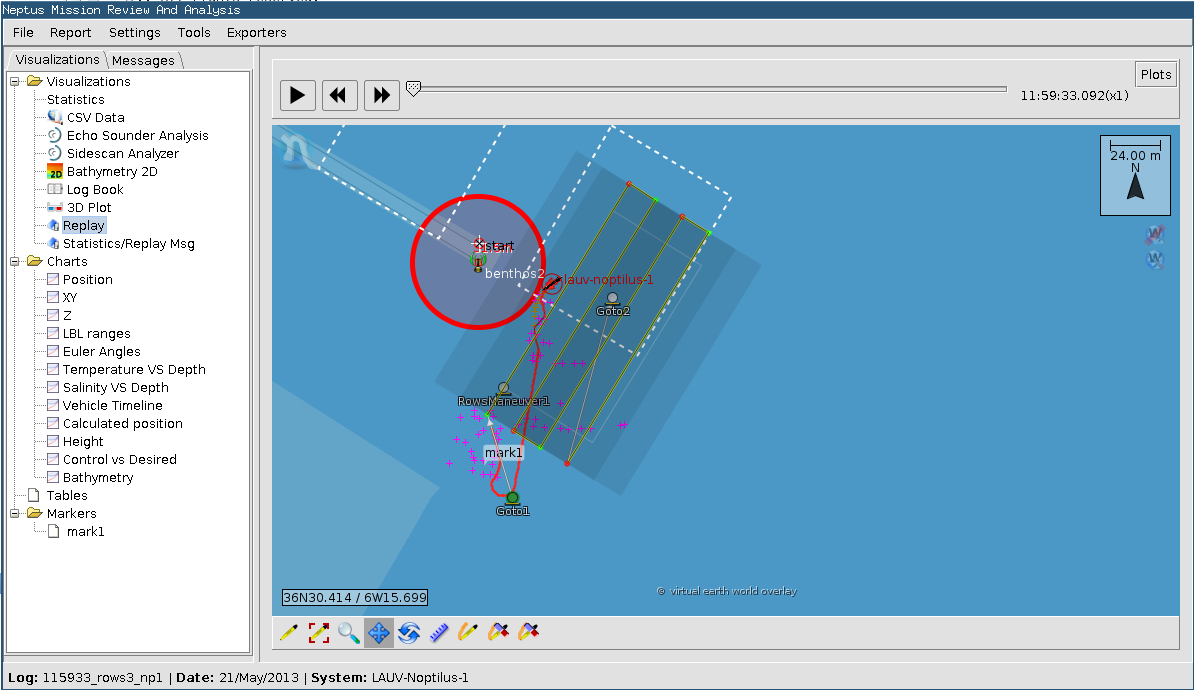
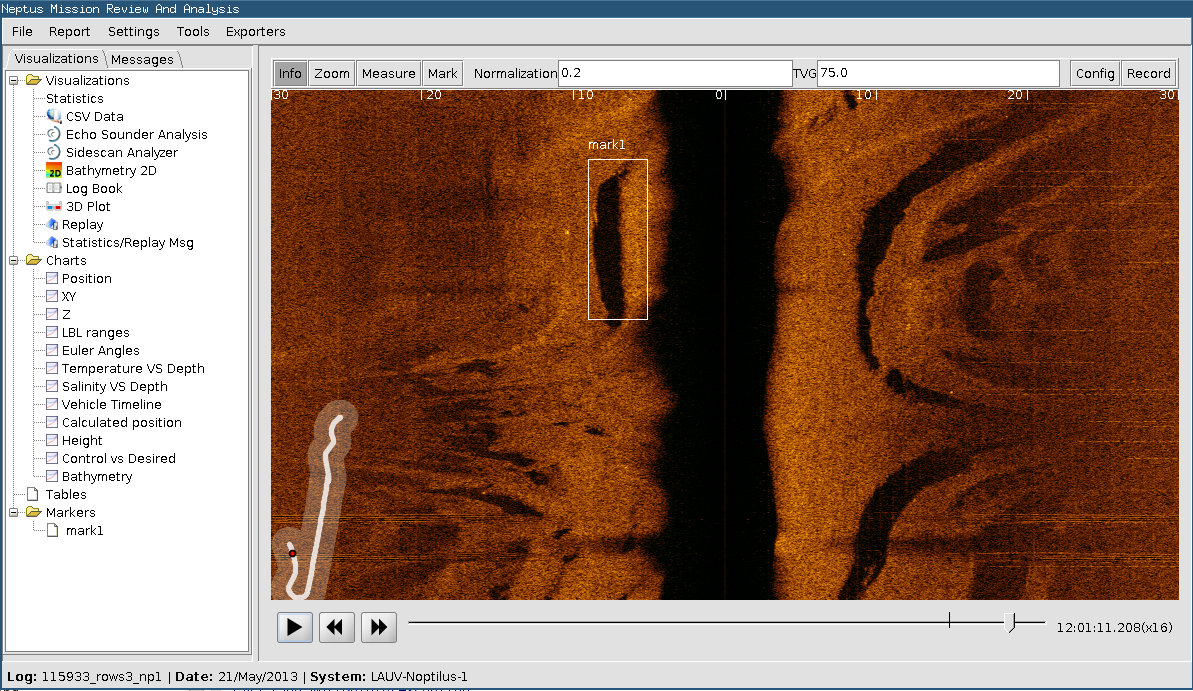
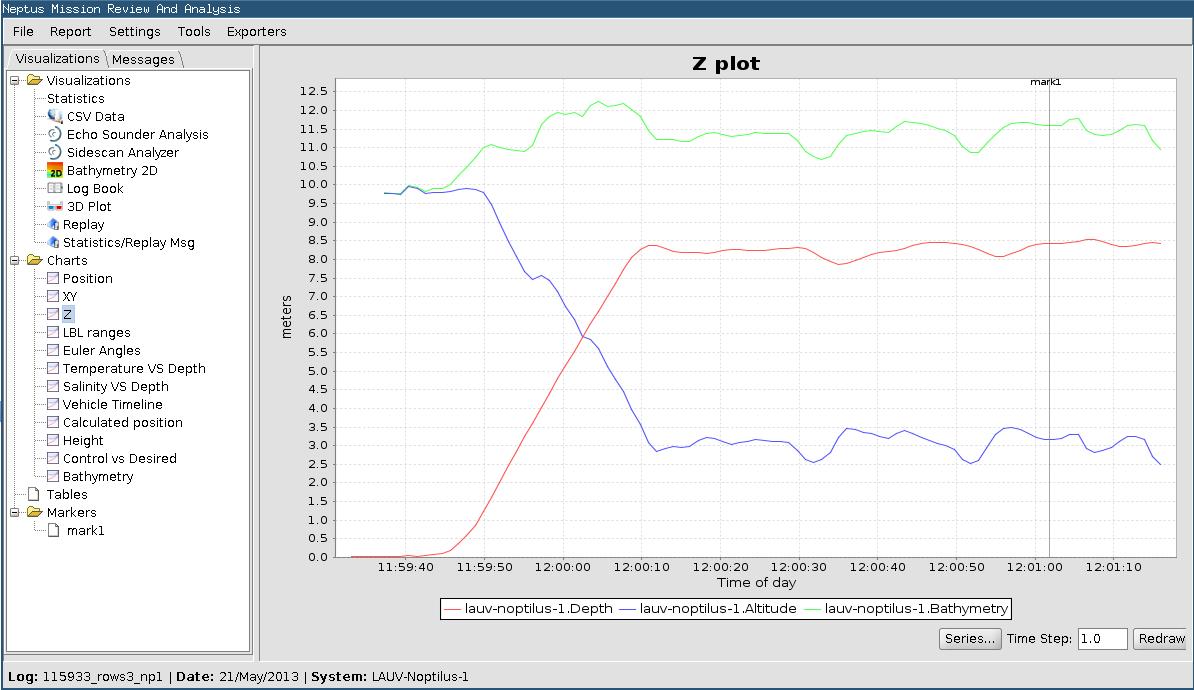
8.4.8. Log Preview
This map interaction mode allows the user to quickly view data from previously
executed missions on top of the main console map.
In order to load data from a previously executed mission, the user must enter the log preview
interaction mode by clicking the respective icon in map toolbar.
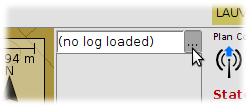
After entering the Log Preview mode, a new control panel appears on top of the map. Using this panel, the
user can choose to open an existing LSF log file and, from there, select witch data overlays (layers) become
visible. The user must select a Data.lsf file.
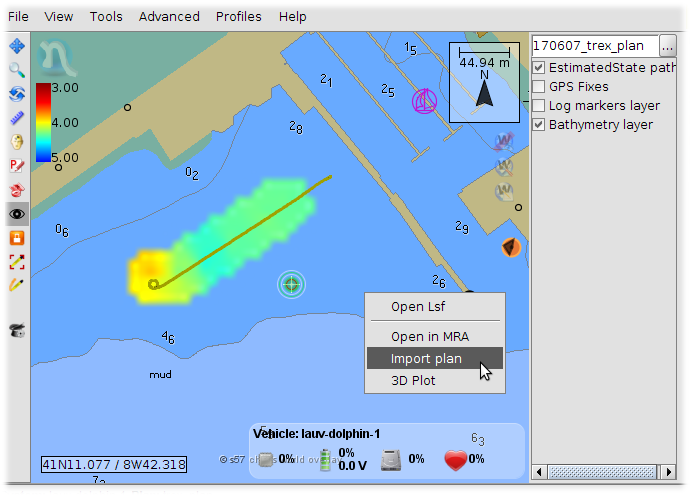
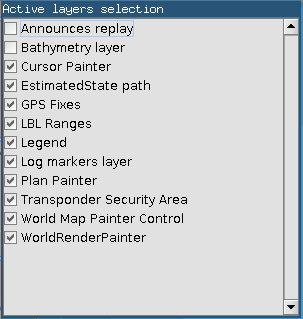
When a log file is selected, a list of available data visualizations (map overlays) becomes visible
as a set of check boxes. Only the selected overlays are displayed on the map. According to the selected
log file, the list of available overlays may differ.
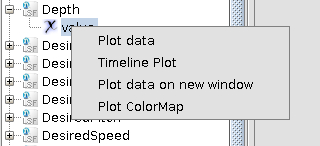
When a log has been successfully opened, the user can also right-click anywhere over the map for a list
of aditional actions:
Open LSF – Open a different log file.
Open in MRA – Open this same log file using the Neptus Mission Review and Analysis application.
Import plan – Import the plan that was executed by the vehicle to produce this log into this console.
3D Plot – Show the vehicle’s trajectory in 3 dimensions (popup window).
Note
 If the user selects a different map interaction mode, the Log Preview toolbar
is hidden but the selected overlays, on the other hand, remain visible.
If the user selects a different map interaction mode, the Log Preview toolbar
is hidden but the selected overlays, on the other hand, remain visible.
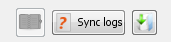
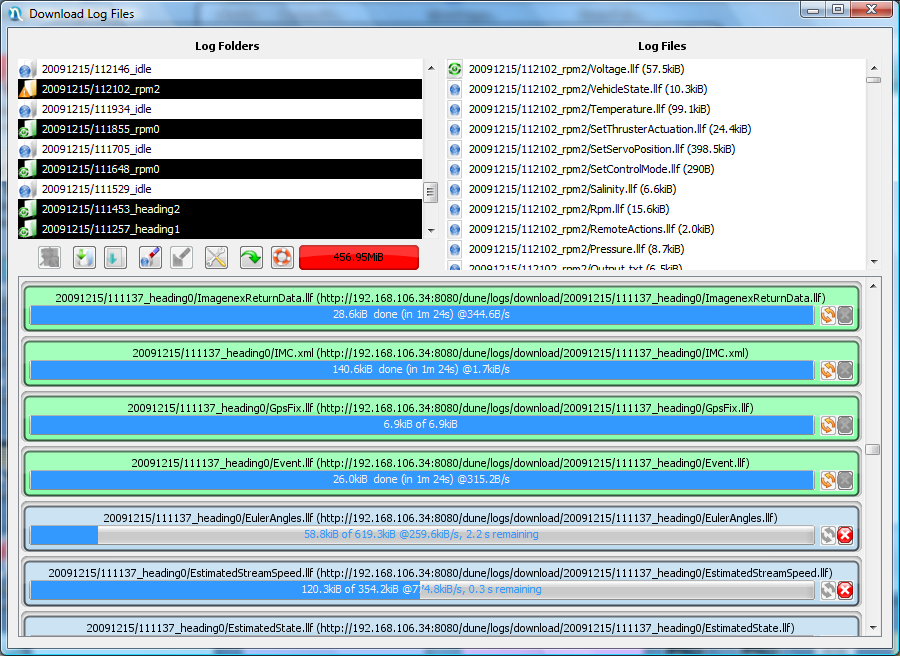
8.4.9. Logs Downloader
This component is the one that can be integrated into an operational console to control
the logging on a system/vehicle (see the figure bellow). The panel is composed of three
buttons.
By clicking it will ask for a new name for the log about to be started.
Buttons explanation.
| Symbols |
Description |
|---|
 |
Start a new log. |
 |
Download all missing logs from main vehicle, if there is connectivity.
The logs to be downloaded will be the logs only from the current day.
It also summarizes the state of the download (logs from the day).
For more control over the logs to download open the download panel.
|
 |
Open the actual downloader, see the next section for a detailed
description. |
Warning
The log list is not automatic to not overload the vehicle server. To get
the list and download click it to get just the list use the next described dialog.
8.4.10. Main Vehicle Selector
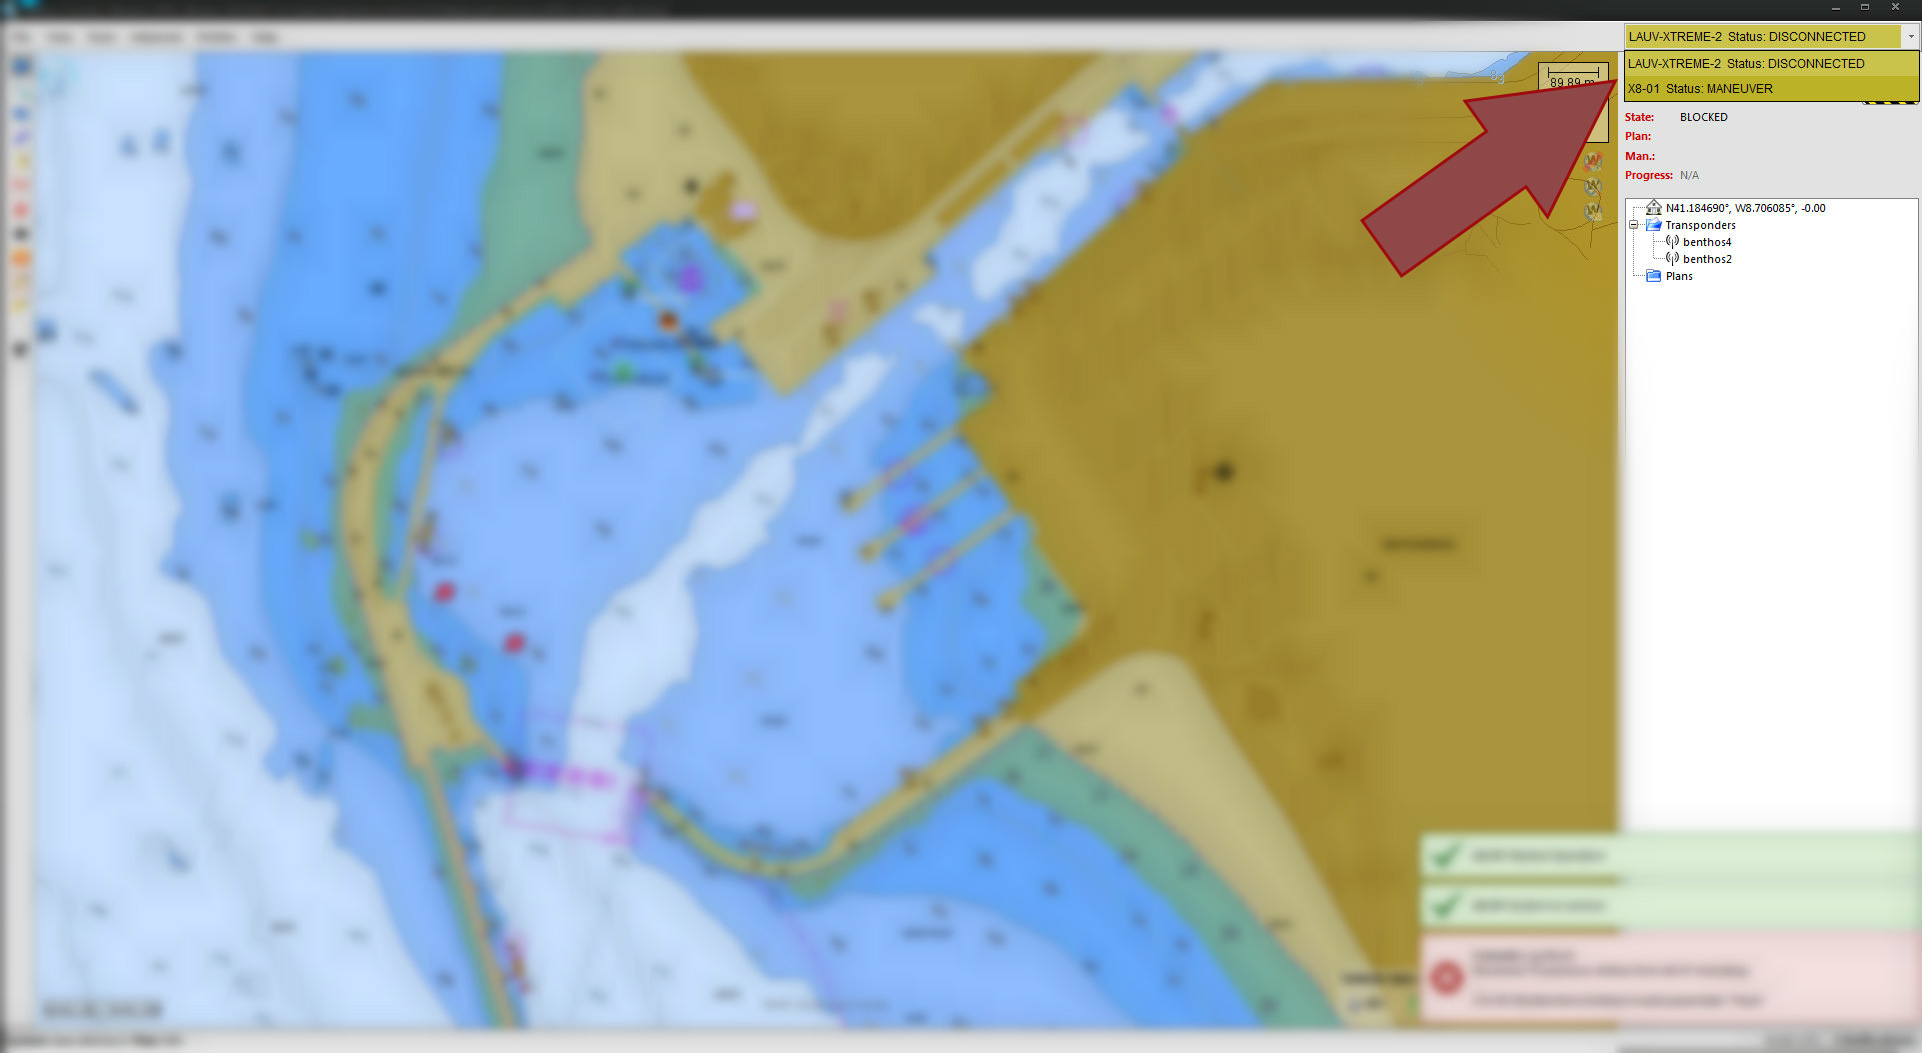
Main System Selector
The Main Vehicle Selector provides two important functions :
- Lets the operator select a vehicle to control
- Informs the operator about the overall state of all connected vehicles
This selector provides an easy and centralized way to switch control between multiple vehicles. When the operator selects a main vehicle all other components are notified.
The operator can also watch the vehicle state with this selector, which vehicle has his state right beside the name. The vehicle state is described with a name and a color scheme associated with his critical level. The different vehicle states are :
- CONNECTED (Level: Success)
- Neptus connected to a vehicle
- BOOT (Level: Information)
- The vehicle is booting DUNE
- SERVICE (Level: Success)
- The vehicle is ready to start operations
- CALIBRATION (Level: Information)
- The vehicle is calibrating is sensors to start a plan
- MANEUVER (Level: Warning)
- The vehicle is executing a plan
- ERROR (Level: Error)
- The vehicle is in error
- TELEOPERATION (Level: Warning)
- The vehicle is being controled manualy
- DISCONNECTED (Level: Warning)
- Neptus lost WIFI comunications with the vehicle, this means the vehicle was turn off or is underwater
- EXTERNAL (Level: Warning)
- Non DUNE external controller operating the vehicle
The figure describes the color scheme and the critical levels.
8.4.11. Mission Tree
This component shows the elements stored in the mission: the home reference, the beacons and the plans. It also allows to act upon each element.
The icons next to each element contains information about it (see table Element icons)s. Both plan and beacon use colored circles
to show synchronization status.
Element icons
| Icon |
Name |
Description |
|---|
 |
Home reference |
The reference to center the map. Should correspond to operator
location. |
 |
Beacon |
A beacon element. |
 |
Plan |
A plan element. |
 |
Syncronized |
The element exists both in the console and the vehicle. |
 |
Unsynchronized |
The element’s id corresponds to a different definition in the console
and in the vehicle. |
 |
Remote |
The element’s id only exists in the vehicle. |
| (white background) |
Local |
The element’s id only exists in the console. |
 |
Acoustic |
The plan can be sent underwater (has an id with just one letter) |
 |
Multivehicle |
|
When in an underwater mission using transponders, next to the name of the transponder will appear the elapsed time since the last accepted range.
This will turn from green to red if too much time has passed for safety.
8.4.11.1. The Actions
All the available actions will be list by pressing the right mouse button. Some actions are always available while others are specific to element
types or just need to have an element selected. To act upon an element select it with the left mouse button and then press the right mouse button.
8.4.11.1.1. Reload Panel
Refresh the listing of elements in the mission tree.
8.4.11.1.2. View/Edit elementA
Change any aspect of the location of elementA.
8.4.11.1.3. Remove elementA
Remove elementA from the mission. If elementA happens to be a plan, it will stay in the mission tree with a purple circle showing that the vehicle
still knows this plan.
8.4.11.1.4. Switch beaconA with beaconB
Switch the configuration associated with the name beaconA to the name beaconB and vice-versa. This is useful when the operator notices that
the beacons are inserted in the right location with switched the names.
8.4.11.1.5. Add A New Transponder
Opens the dialog to insert a new beacon into the mission.
8.4.11.1.6. Send planA to vehicleA
Send the selected plan to the main vehicle (vehicleA).
8.4.11.1.7. Remove planA from vehicleA
Remove planA from the main vehicle (vehicleA). The vehicle will no longer know the plan but it will still be visible in the mission tree
with no circle, showing that is a local plan.
8.4.11.1.8. Get planA from vehicleA
Get the selected plan from the main vehicle (vehicleA) and into the console.
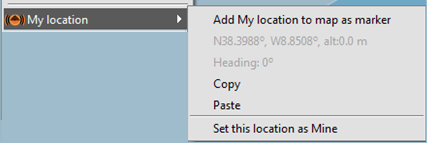
8.4.12. My Location
This operational console component attaches itself on the renderer 2D to draw the Neptus
operator’s location. The icon drawn in the renderer is the following  .
The arrow indicates the bearing of the operator. If the bearing is not known, the arrow
will point north. This component relies on the MyState Neptus functionality. This my be
fed by a GPS connected to Neptus. Depending on the age of the position, the quarter
arcs on the side of the icon shows more or less arcs (four arcs means updated location).
.
The arrow indicates the bearing of the operator. If the bearing is not known, the arrow
will point north. This component relies on the MyState Neptus functionality. This my be
fed by a GPS connected to Neptus. Depending on the age of the position, the quarter
arcs on the side of the icon shows more or less arcs (four arcs means updated location).
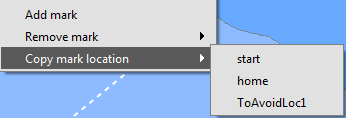
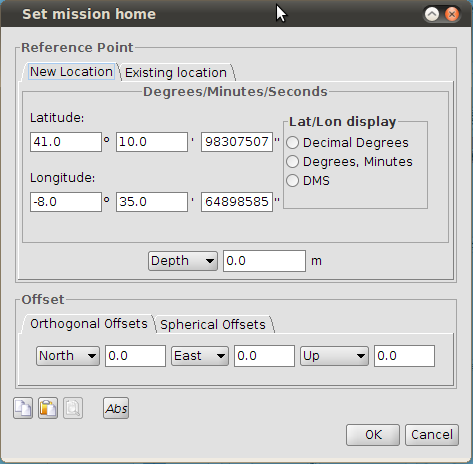
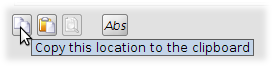
By right click on the renderer you can select the My location menu (see the following
figure). There are some controls on this popup. You can add the your current location
to the map, copy it or force the substitution of your location (this is useful if no
GPS is available).
8.4.13. Notifications
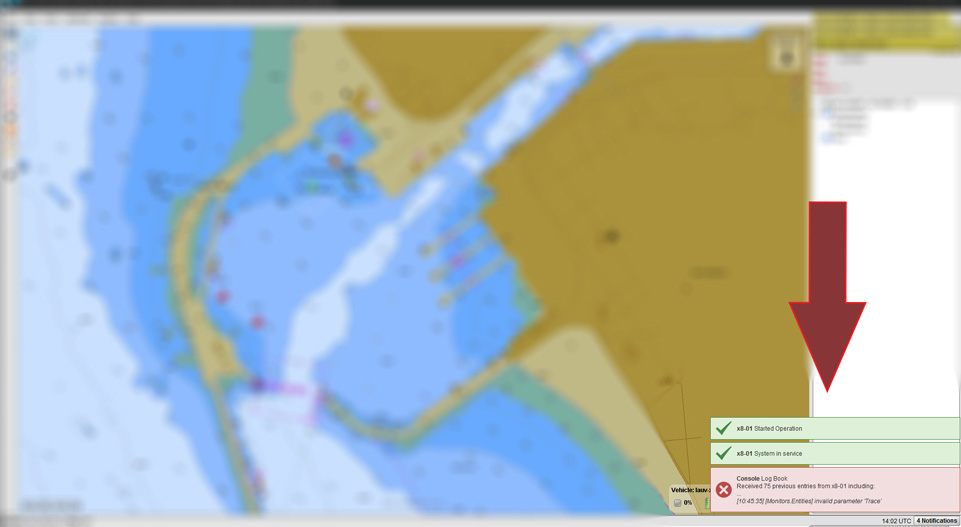
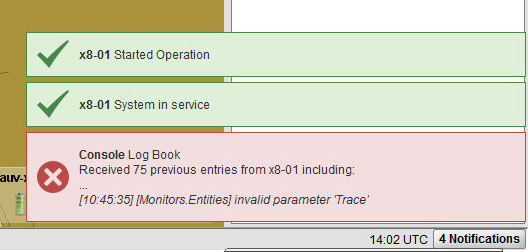
Neptus has a notification system to keep the operator informed about all the important events happening with the connected vehicles. When a important event happens a notification popup will appear at the bottom right corner of the console . The notification disapears after a few seconds with the exception of error events, to dismiss a error notification the operator needs to click the popup.
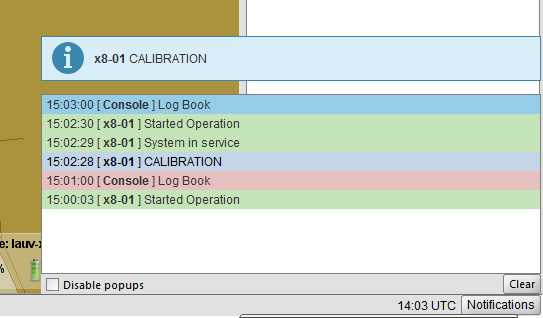
The operator can also open the notifications log clicking the button at the right bottom corner, it opens a window with a list of the last notifications. There is also the option to clear the list and disable popups.
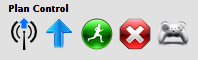
8.4.14. Plan Control
Plan Control allows to interact with the vehicle by sending mission execution related messages. The
panel is shown in the figure.
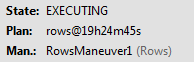
8.4.15. Plan Control State
Plan Control allows to state of the plan execution, which plan is loaded/execution, and the maneuver
of the mission plan the main vehicle is executing.
The panel is shown in the figure.
Additionally some plan progress information may be seen the Notification
area.
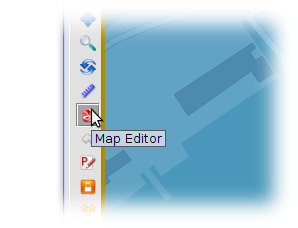
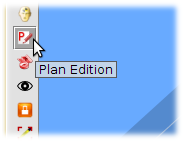
8.4.16. Plan Editor
The plan editor allows the creation and visualization of mission plans inside the operator console. This mode is activated
by pressing the respective button in the map toolbar.
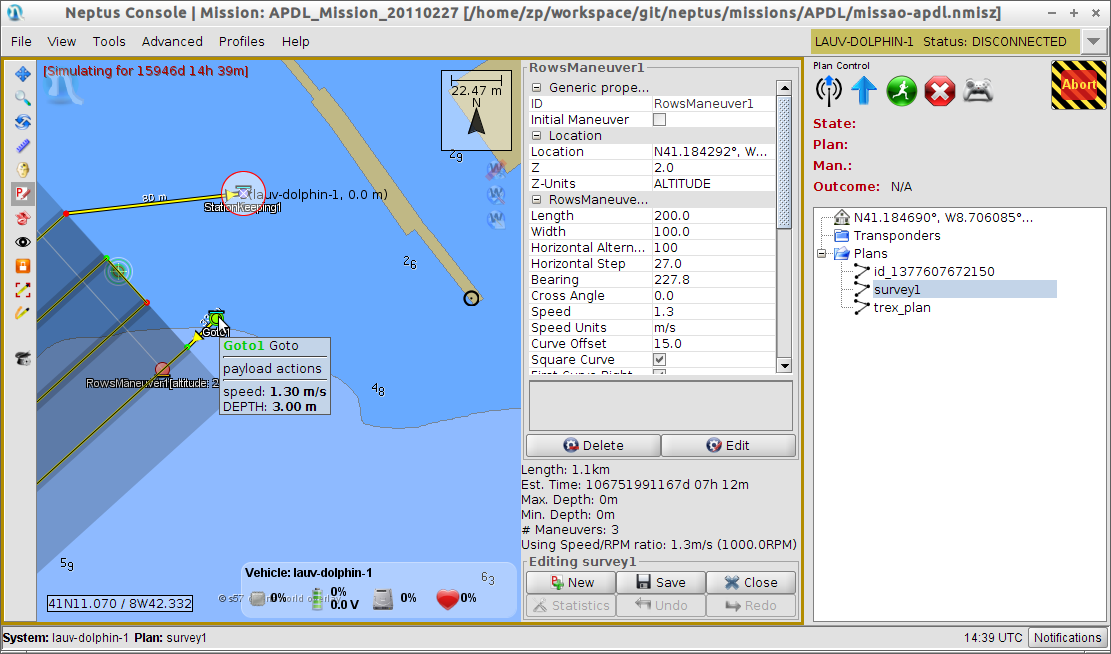
In the plan editing mode, an additional right side bar is presented to the user. From this side bar it is possible to see an overview
of plan statistics, create, save and close plans, as well as access a list of parameters of the currently selected maneuver.
To create a new plan, the user should click the button “New” on the planning side bar. If there is a plan currently being edited,
it must be closed and thus the user is prompted to save or discard any changes made to plan currently being edited. After making a
decision, a new dialog is presented to the user where he can select the target vehicle for the new plan. This is used to allow
adding to the plan only maneuvers which are compatible with the selected vehicle. Moreover the default parameter values of newly
added maneuvers are set according to the vehicle chosen here.
After choosing the vehicle, a new (empty) plan is created. This empty plan is not valid as it doesn’t have any maneuvers.
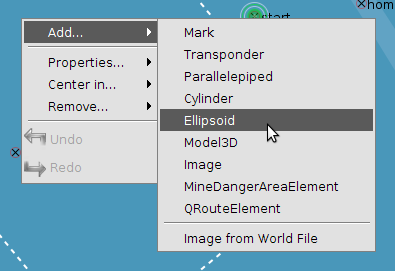
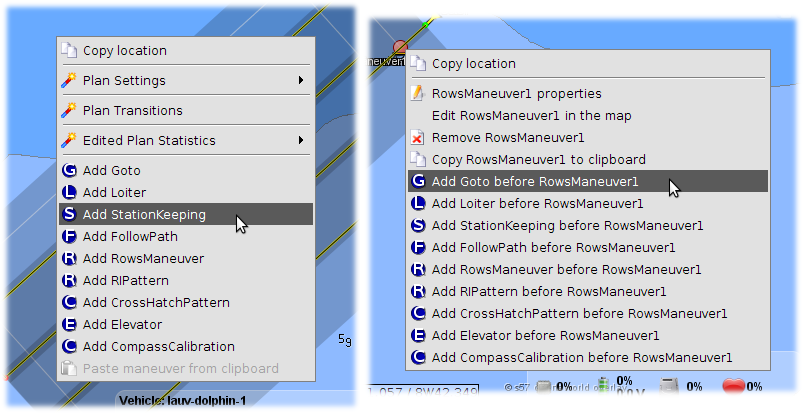
To add maneuvers to the plan, the user must right click on the map (when in plan edition mode). If the clicked position corresponds
to the position of a maneuver already in the plan, there will be options to add all compatible maneuvers either at the end of the plan
(sequence of maneuvers) or before the currently selected maneuver. In the latter, the added maneuver will be added after the maneuver
that precedes the clicked maneuver.
The added maneuvers will use the default parameters for the plan’s vehicle. The parameters of any maneuver can be set by selecting
the maneuver in the map (clicking over it) and then using the planning side bar on the right which is always populated with the
parameters of the currently selected maneuver.
Moreover, the user can add a maneuver which is similar to the previous one by pressing control and clicking anywhere on the map.
If several maneuvers are overlapped (same position in the map), each of this maneuvers can be selected by clicking one or more times
over the position of those maneuvers. Each time the position is clicked, a new maneuver under that point will be selected (iterated).
Maneuvers that are parameterized by their location can be dragged in the map in which case, the user is actually changing the location
parameter for that maneuver. The plan itself can be dragged on the map. For that, the user can drag any maneuver while pressing
the CONTROL button.
Apart from editing the maneuvers by using the planning side bar, some maneuvers can also be edited directly on the map like FollowPath,
FollowTrajectory, RowsManeuver and RIPattern. In the case of these maneuvers, the user can double click the maneuver to enter
the map edition mode for that maneuver.
Each maneuver has a specific map edition mode so please consult the maneuver-specific information in the Maneuvers section.
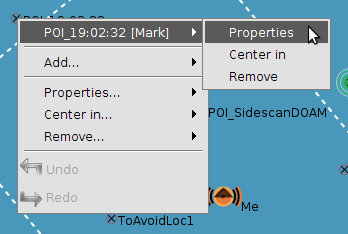
To remove maneuvers that have already been added to the plan, the user can right-click a maneuver and the select
Remove xxx where xxx is the name of the clicked maneuver as seen here. If the maneuver
is not the last one, the maneuver that follows it, will become connected to the maneuver that precedes the
deleted maneuver.
To facilitate plan edition, the user can also duplicate the plan’s last maneuver by clicking the map while
pressing the CONTROL key. This will create a new maneuver in the clicked position that has same type and
parameters as the last maneuver in the plan. Moreover, maneuvers can also be copied to the clipboard and
pasted at the end of the plan. This is done via the right-click menu seen in this figure.
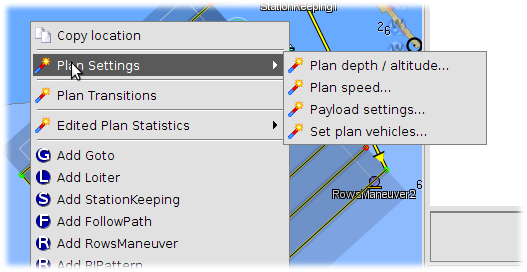
8.4.16.1. Plan Settings
When the user right-clicks the map in the Plan Editor map interaction mode, it can also use the Plan Settings menu
actions for settings that are common to all maneuvers in the plan:
- Plan depth / altitude – will open a popup dialog where the user can select the depth or altitude to be
set to all maneuvers in plan that have this parameter.
- Plan speed – will open a popup dialog where the user can select the speed to be
set to all maneuvers in plan that have this parameter. In this dialog the user can also choose the units to be
used.
- Payload settings – will open a popup dialog where the user can choose a common payload configuration to
be used in the entire plan.
- Set plan vehicles – for advanced users, the target vehicles for the current plan can be changed from here.
Note
After a setting is applied to the entire plan it will be committed to ALL the maneuvers in the plan. However,
the user can later change the same setting in one or several specific maneuvers.
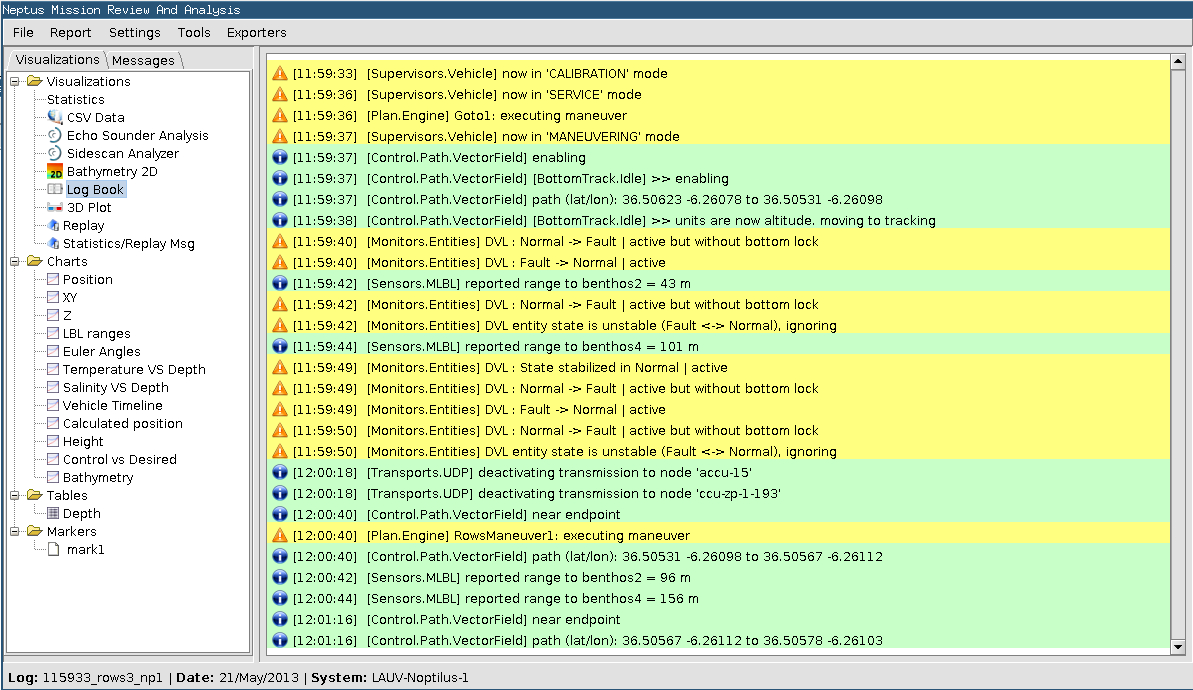
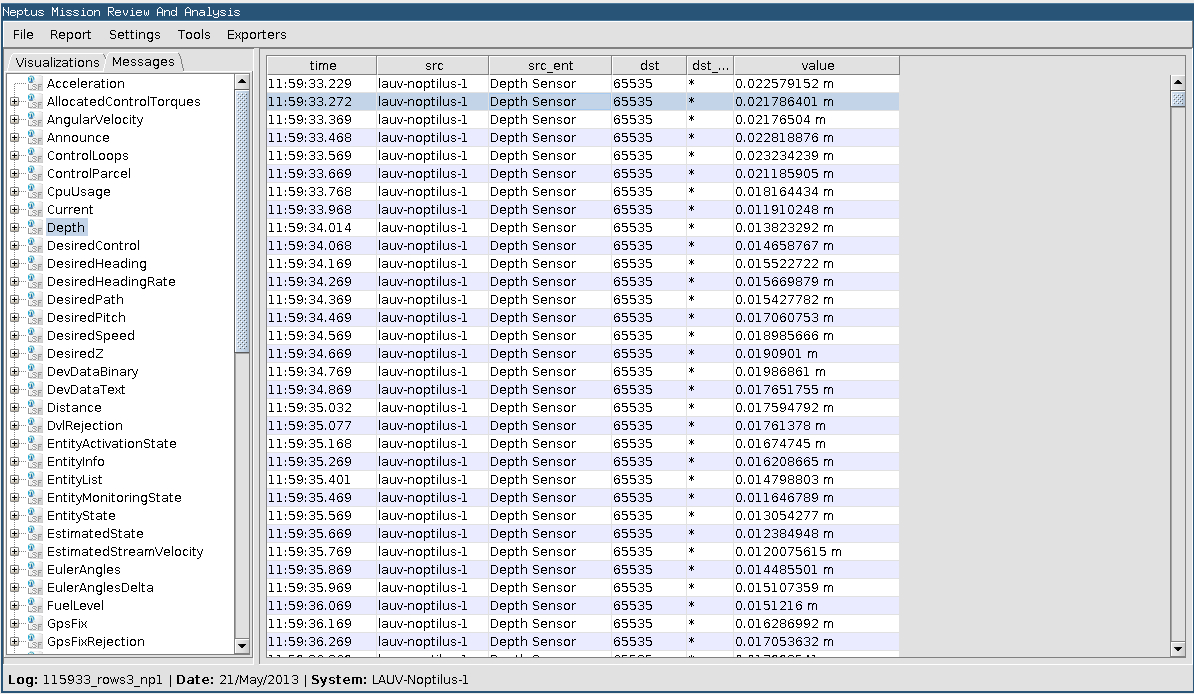
8.4.17. LogBook History
This operational console component allows the visualization the vehicle low level
log output. The next figure depicts this panel.
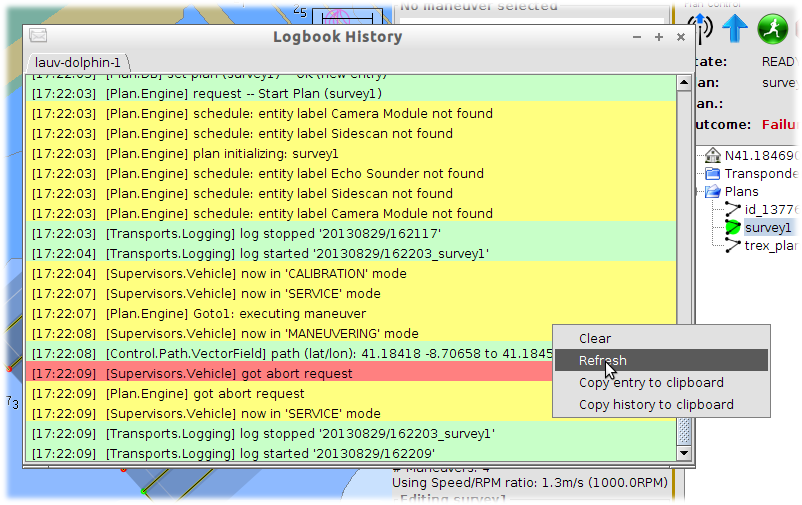
LogBook History Popup window
Note
Please note that these messages are low level logs and normally you don’t need
to look at them very often.
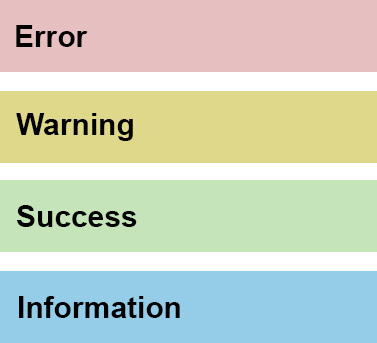
By opening the Remote History dialog the vehicle low level messages can be observed. The coloring
of the entries varies according to the importance of the information. Red for highest importance (errors)
yellow for medium importance (warnings) and green for low importance (information).
8.4.18. Simulation Utilities
Neptus operator console provides a range of simulation utilities that help the user
predict and understand how a plan is executed by the vehicle.
8.4.18.1. Automatic plan execution preview
Whenever a vehicle is executing a plan, the console’s simulator executes the same plan in
the background. This is done so that, whenever the vehicle becomes disconnected, the simulated
position of the vehicle becomes visible to the user. This is of special interest when the
vehicle executes missions underwater, with no connectivity to the surface.
Note
Be aware that the simulator calculates what the vehicle does with no outside
disturbances such as currents, actuator malfunctions or obstacles. The actual state of
the vehicle usually differs from the one shown in the simulator.
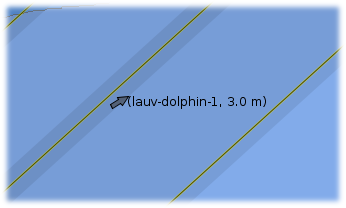
When the vehicle stops reporting its state, the simulated vehicle position is shown as gray
arrow on the map. The simulated depth is also shown next to the vehicle’s name.
8.4.18.2. Plan execution preview
Neptus also provides a simulation map interaction mode where the user can simulate any of the plans
available in the console (independently of what the real vehicle is currently doing).
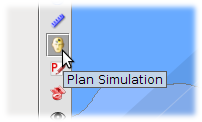
To enter this interaction mode, the user must select the Plan Simulation interaction mode.
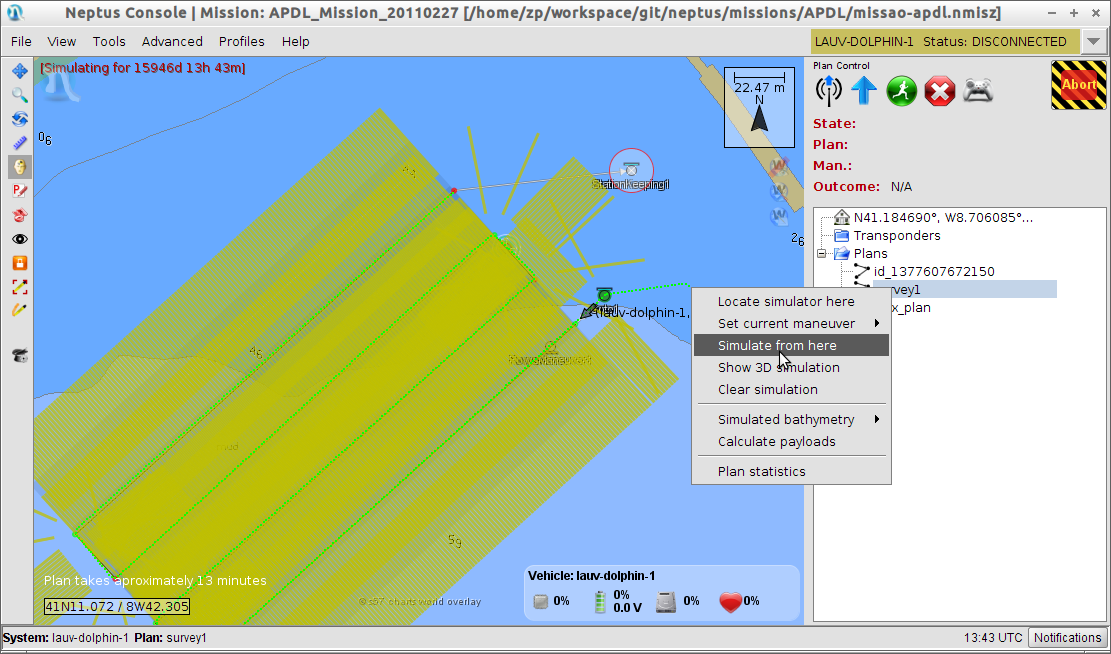
In the Plan Simulation map interaction mode, the user may select to simulate the currently selected plan
by right-clicking a point in the map and choosing the option Simulate from here. This will generate the path
the vehicle should exhibit when executing the plan starting from the clicked position.
The path is represented as a series of colored dots. The color of the dots varies from green to red and is
related to the amount of energy available at that point in the mission. The initial amount of energy corresponds
to the last battery state received from the vehicle.
As soon as the execution preview starts, the vehicle simulated position is shown to the user. To advance in the
simulation, the user can right-click anywhere near another simulated state (colored dot) and choose the option
Locate simulator here. This will resume simulation from there.
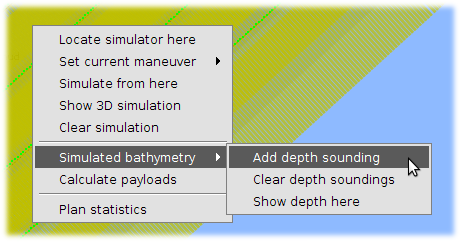
8.4.18.3. Simulated bathymetry and payloads
A useful feature of the Plan Simulation interaction mode is to display in the map the areas covered by the
sensor payloads, as configured in the plan. The covered area varies according to the payload configuration, the
vehicle’s trajectory and the depth of the ocean’s floor.
The payload footprints are shown as different color bars overlayed on the map. Yellow bars represent sidescan
sonar sensor coverage and blue bars represent multi-bean sidescan sonar sensor coverage. Only in the maneuvers
where a payload has been explicitly activated it will be calculated and shown in the map.
In order to simulate the bathymetry of the ocean floor, this interaction mode also allows the user to enter a
number of depth soundings. For this, the user must click a point in the map and then select the option
Simulated Bathymetry–>Add depth sounding.
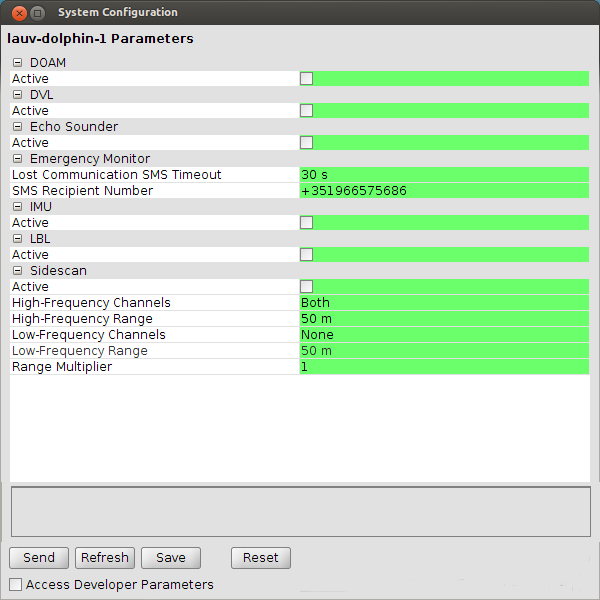
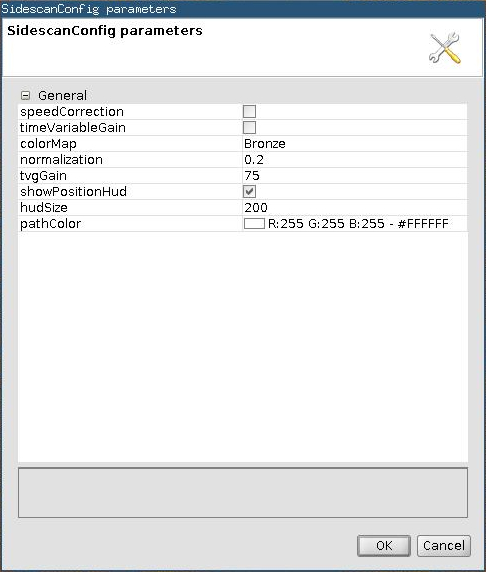
8.4.19. Systems Configuration
The system configuration holds the vehicle internal configurations parameters. Its store in Neptus,
and holds default values. These default values may not match the current vehicle values
(see sec_systems_configuration).
There are four levels of access: Global, Idle, Plan (configurable in a plan), and Maneuver (configurable
in the maneuver in a plan).
The figure Systems Configuration depicts the interface.
The buttons have the following funcionalities:
- Send (send to vehicle, if not saved on vehicle reboot they will be reset)
- Refresh (synchronize with the vehicle)
- Save (saves in the vehicle, this will make the vehicle on reboot to use these values)
- Reset (put the default values, needs to be sent to vehicle)
The color codes that aperar associated wit every parameter value have the following meaning:
- Red (different from the vehicle)
- Green (the same as the vehicle)
Warning
Remember to get the values from the vehicle to be sure that they are in sync.
Warning
Changing advanced settings may result in an inoperable vehicle.
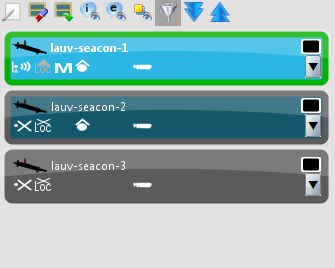
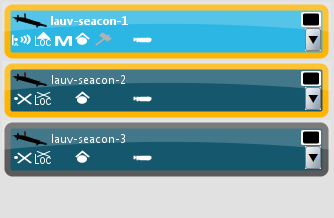
8.4.20. Systems List
The Systems List shows the known systems and it’s summary state (the filter may
hide some systems from the list).
The next figure depicts some of the states each system can present. The state is
presented by the background color and symbols.
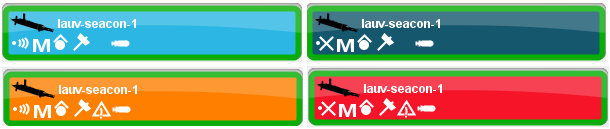
System List Background Color Codes
| Color |
Description |
|---|
| Cyan |
When there is connectivity and no errors. |
| Dark Blue |
When there doesn’t exist connectivity and there were no errors. |
| Orange |
When there is connectivity and there are errors. |
| Red |
When there doesn’t exist connectivity and there were errors. |
| Grey |
When the system is not being directly followed and the indications
are by the state of the icons only. (Less distractive this way.) |
There is also the border color (see following figure). In this case there are three
colors: grey (with no meaning); green (means that the system is the main system in the
operational console, also the main system symbol is active); and orange (means the
system is selected, this color over imposes on the green color for the main system).
Warning
The selection option is not available in all Neptus distributions. The availability
depends on the purpose of use.
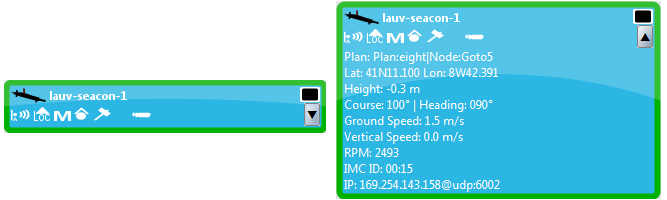
The next figure shows the info shown in each system box state: collapsed or extended.
In the collapsed format only the system image, name and symbols state indicators are
shown (as seen in figure on the left). The meaning of the symbols will be explained
bellow. In the extended format, along the state symbols, is shown textual information
of the state (with additional information that is not shown in the state symbols).
You can notice on the top right a square box with white borders. This, when available, allows the
change of the color that the system will be drawn with on the map.
The following tables explains the state symbols. Some of these symbols can have attached actions that
allow changing the state of it. This is seen by the drawing of a border around the symbol when passing
the mouse on top of them. In these symbols, their actions can be trigged by right click on top
of them.
System List Symbology Description (Location)
| Symbols |
Description |
|---|
  |
This symbol indicates if the location of a system is known. The first indicates that the
location is not known for more than 10s. The second indicates the location is known. |
System List Symbology Description (Console Main System)
| Symbols |
Description |
|---|
 |
This symbol indicates that the system is the operational console main system. |
System List Symbology Description (Authority)
| Symbols |
Description |
|---|
   |
These symbols sets the authority (locally).
The first symbol, with a hat, indicate that you want to pay attention more closely of
what they are doing. The symbol means full authority.
The systems with these authorities have the more information shown to the operator. The main
system has always a full authority.
The symbol with a full circle (without the hat) means none authority. These systems are
not of main focus for the operator but their location is important.
The symbol with a full circle, a hat, and a cross on top means off. By marking a system
with this authority, the operator is marking a no interest in the system. Neptus will drop
all messages (except the general announce message) from that system, also no messages will
go out to it.
|
System List Symbology Description (Executing a Plan)
| Symbols |
Description |
|---|
 |
When present, means that the vehicle is executing a mission plan. |
System List Symbology Description (Error State)
| Symbols |
Description |
|---|
 |
When this symbol is visible, means that is something wrong with the system and
requires attention. This symbol matches the background colors for errors mentioned
above. |
System List Symbology Description (Two or More Instance Sources)
| Symbols |
Description |
|---|
 |
If this symbol is shown that means the the data received for the system is arriving from
two or more instance sources. This warning must be dealt with immediately.
One must notice that in case a system is restarted and in consequence of this the instance
id changes. In this case this indication appears in an transient manner.
|
System List Symbology Description (Fuel Level)
| Symbols |
Description |
|---|
   |
This symbol indicates the fuel level of the vehicle. If a ‘?’ character appears it
means that there is no updated info and the info shown is the last known. If ‘!’ appears
means that the fuel level is at 10%. |
There are also some control buttons that can be used to change the behavior of this component.
The next figure depicts those control buttons.
The first button opens the component configuration that is depicted in the figure bellow.
- Systems Icons Size and System Indicator Icons Size: Configures the state symbols
size for the system box (the first) or the OSD (on screen display) balloon.
- Main System Icon Size Increment: Configures the increment in size for the system box for the
operational console main system.
- Show System Symbol Or Text: Configures if for the system type symbol will use the picture
symbol or the text version.
- System Class Filter: This is the filter. This filter will show in the list only the system
that match the filter. The choices are VEHICLE, CCU, STATICSENSOR, MOBILESENSOR, and ALL.
- System Vehicle Class Subtype Filter: In case the previous filter is VEHICLE, can filter by subtype. The
choices are UUV, USV, UGV, UAV, and ALL.
- Systems Ordering: This configures if the systems should be shown UNSORTED or SORTED
- Show System With Authority Equal Or Above: This configures if the systems should be shown
dependent on the Authority State.
- Systems Ordering Option: This configures the ordering type. The choices are ID, ID_AUTHORITY,
and ID_AUTHORITY_MAIN
- Enable Selection: Configures if system selection is active or not
- Renderer Icons Size: Configures the system symbols size for the renderer
- Show Systems Icons That Are Filtered Out: If true, if this component will show systems
icons on renderer that were filtered out. Option to show system icons has to be enabled
- Show External Systems Icons: If true, if this component will show external systems icons on
renderer. Option to show system icons has to be enabled.
- Minimum Speed To Be Stopped: Configures the maximum speed (m/s) for the system to be considered
stopped (affects the drawing of the course/speed vector on the renderer)
- Draw System Label: Configures if this component will draw the system label on the renderer
- Use Mil Std 2525 Like Symbols: This configures if the location symbols to draw on the renderer
will use the MIL-STD-2525 standard
- Mil Std 2525 Symbols Filled Or Not: This configures if the symbol is to be filled or not.
- Minutes To Hide Systems Without Known Location: Minutes after which systems disappear from
render if inactive (0 to disable)
- Draw Circle Around System Icon In Render Dependent Of System Type: This configures if the circle
around the symbol in render is to be drawn dependent of system type
The second ( ) and third (
 ) buttons are related
with the selection features. The first clears the selections and the other redo the last selections.
) buttons are related
with the selection features. The first clears the selections and the other redo the last selections.
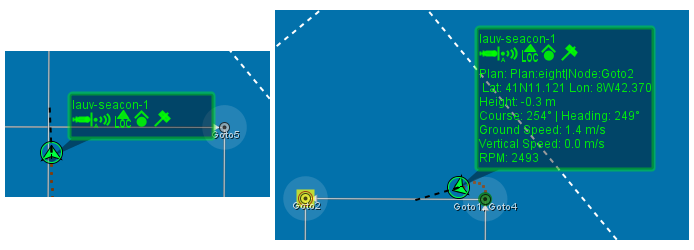
Next there are three buttons with an eye
( ,
,  ,
,  ).
The first two have blue balloons. The one with an
‘i’ activates the OSD info balloon on the renderer (figure bellow on the left). This will be
similar with the collapse system box display. The one with an ‘e’ activates the extended OSD
info balloon on the renderer (figure bellow on the right). this is similar with the extended
system box display.
).
The first two have blue balloons. The one with an
‘i’ activates the OSD info balloon on the renderer (figure bellow on the left). This will be
similar with the collapse system box display. The one with an ‘e’ activates the extended OSD
info balloon on the renderer (figure bellow on the right). this is similar with the extended
system box display.
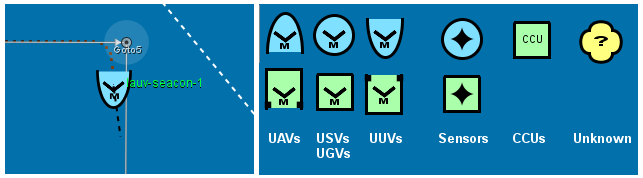
The button with an eye and a yellow square enables the drawing of the location system icon
on the renderer (the renderer itself may draw an icon of its own, see the configuration on
how to disable it). This system icon can be seen in the following figure.
In the configuration description above, there is one that can enable the use the MIL-STD-2525
standard symbology. This does not completely implements the standard but uses it’s notions.
On the figure bellow you can see the symbols used. (Note that for best display you should
disable the renderer to draw the own’s system icon, as explained in the configuration section
above.)
If the Draw Circle Around System Icon In Render Dependent Of System Type is ticked in the
configuration, instead of a circle around the icon, something similar to the border used to
differentiate the system type for MIL-STD-2525.
The filter button ( ) activates or deactivates the filter set (explained in
the configurations). If disabled all the systems will be shown.
) activates or deactivates the filter set (explained in
the configurations). If disabled all the systems will be shown.
The blue double arrows ( ,
,  ) are for putting all systems
boxes to the extended format information (the button with the arrows pointing down). The
other puts all the systems boxes to the collapse format.
) are for putting all systems
boxes to the extended format information (the button with the arrows pointing down). The
other puts all the systems boxes to the collapse format.
One of the important functionalities of this component is the choice or change of the
operational console main system. To operate such a change one can mouse click
on the system box of choice while pressing the Ctrl button.
To make one system active/deactivate on the console (authority none), one can mouse click
on the system box of choice while pressing the Ctrl+Alt buttons.
8.4.20.1. Systems Colors Drawing on the Map
As mentioned earlier, the systems’ locations will be drawn on the map (these will be affected by the
filters that are applied).
The main system will always use a green (RGB: 0, 255, 64) color (so avoid this colors when
choosing color for the systems). If not the main system and on the systems list, if available,
the system color will be used, if not white.
For systems not on the systems list will be drawn with the color khaki (RGB: 210, 176, 106).
For external systems the color to use is plum red (RGB: 255, 0, 255). External systems are
systems that are known to Neptus indirectly.
Warning
External systems arrive to Neptus from sources that depend on the distribution configuration.
So not all installations will have this available.


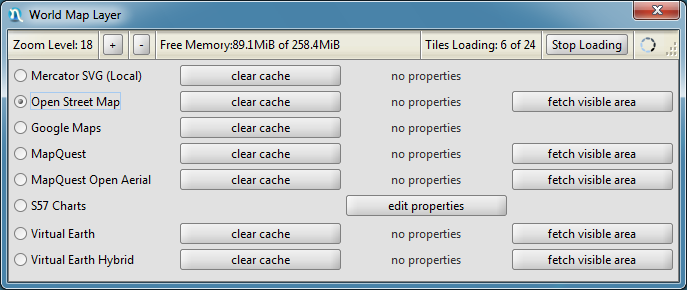

 If you download the tiles in the mission preparation phase while you have Internet
access, you can use them while on mission and without Internet access.
If you download the tiles in the mission preparation phase while you have Internet
access, you can use them while on mission and without Internet access.